简介
因为怕argocd同步完应用失败之后没有告警,所以想用prometheus去告警
操作
我使用的是kube-prometheus去搭建的prometheus,所以不出意外你的配置和我的差不多
创建3个service monitor
apiVersion: monitoring.coreos.com/v1
kind: ServiceMonitor
metadata:
  name: argocd-metrics
  namespace: argocd
  labels:
    release: prometheus-operator
spec:
  selector:
    matchLabels:
      app.kubernetes.io/name: argocd-metrics
  endpoints:
  - port: metrics

---

apiVersion: monitoring.coreos.com/v1
kind: ServiceMonitor
metadata:
  name: argocd-server-metrics
  namespace: argocd
  labels:
    release: prometheus-operator
spec:
  selector:
    matchLabels:
      app.kubernetes.io/name: argocd-server-metrics
  endpoints:
  - port: metrics

---
apiVersion: monitoring.coreos.com/v1
kind: ServiceMonitor
metadata:
  name: argocd-repo-server-metrics
  namespace: argocd
  labels:
    release: prometheus-operator
spec:
  selector:
    matchLabels:
      app.kubernetes.io/name: argocd-repo-server
  endpoints:
  - port: metrics
如果正常的话就会识别到3个target
之后创建告警规则
apiVersion: monitoring.coreos.com/v1
kind: PrometheusRule
metadata:
  labels:
    app.kubernetes.io/component: prometheus
    app.kubernetes.io/name: prometheus
    app.kubernetes.io/part-of: kube-prometheus
    app.kubernetes.io/version: 2.26.0
    prometheus: k8s
    role: alert-rules
  name: argocd-app-sync
  namespace: monitoring                                     # Required label key and value
spec:
  groups:
    - name: ArgoCD                                              # Name of the prometheus rule group
      rules:
        - alert: ArgoAppOutOfSync                               # Name of the alerting-rule
          expr: argocd_app_info{sync_status="OutOfSync"} == 1   # Triggered when argocd-application is `OutofSync`
          for: 1m                                               # Duration for which expression should evaluate to true
          labels:                                               # Labels added to triggered alert
            severity: warning
          annotations:                                          # Annotations added to triggered alert
            summary: "'{{ $labels.name }}' Application has sync status as '{{ $labels.sync_status }}'"
        - alert: ArgoAppSyncFailed                              # Name of the alerting-rule
          expr: argocd_app_sync_total{phase!="Succeeded"} == 1  # Triggered when argocd-application is not succeeded
          for: 1m                                               # Duration for which expression should evaluate to true
          labels:                                               # Labels added to triggered alert
            severity: warning
          annotations:                                          # Annotations added to triggered alert
            summary: "'{{ $labels.name }}' Application has sync phase as '{{ $labels.phase }}'"
        - alert: ArgoAppMissing                                 # Name of the alerting-rule
          expr: absent(argocd_app_info)                         # Triggered when argocd-application info is not found
          for: 15m
          labels:                                               # Duration for which expression should evaluate to true
            severity: critical
          annotations:                                          # Annotations added to triggered alert
            summary: "[ArgoCD] No reported applications"
            description: >
              ArgoCD has not reported any applications data for the past 15 minutes which
              means that it must be down or not functioning properly.
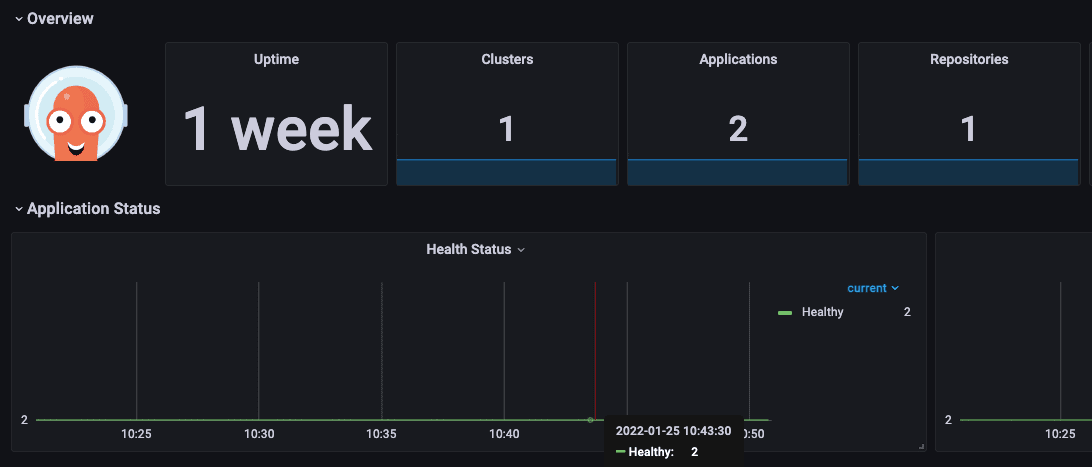
最后可以再grafana中导入你的dashboard
https://github.com/argoproj/argo-cd/blob/master/examples/dashboard.json
当然,除了这种方式可以去监控argocd,官方也推荐了下面几种
https://github.com/argoproj-labs/argocd-notificationshttps://github.com/argoproj-labs/argo-kube-notifierhttps://github.com/bitnami-labs/kubewatch
参考
https://argo-cd.readthedocs.io/en/stable/operator-manual/notifications/
https://argo-cd.readthedocs.io/en/stable/operator-manual/metrics/
欢迎关注我的博客www.bboy.app
Have Fun
