
简介
家里的k8s使用的是kube-prometheus监控的,除了kube-prometheus外,家里还有一套使用docker搭建的prometheus来监控k8s集群外部的主机,最近想整合下,让kube-prometheus也可以去监控其他的集群外部的主机和监控项目
操作
网上有的人是创建endpoint,然后使用serviceMonitor去监控的,也就是说如果我有100台主机,那么就要创建100个serviceMonitor,这显然不是最佳做法,百度了一下发现prometheus可以添加额外的配置文件,详细的可以看下面
https://github.com/prometheus-operator/prometheus-operator/blob/master/Documentation/additional-scrape-config.md
那么思路就有了,在additional-scrape-config里面添加job,然后使用file_sd去发现主机就可以了,而file直接创建成configmap挂载到容器里面,之后添加新的监控主机的话直接修改configmap就可以了
修改配置
添加下面这些就好
# 挂载配置
  volumes:
  - name: prometheus-external-node-exporter-hosts-cm
    configMap:
      name: prometheus-external-node-exporter-hosts-cm
  - name: prometheus-external-temp-cm
    configMap:
      name: prometheus-external-temp-cm
  - name: prometheus-external-windows-cm
    configMap:
      name: prometheus-external-windows-cm
  volumeMounts:
  - name: prometheus-external-node-exporter-hosts-cm
    mountPath: "/hosts"
    readOnly: true
  - name: prometheus-external-temp-cm
    mountPath: "/temp"
    readOnly: true
  - name: prometheus-external-windows-cm
    mountPath: "/windows"
    readOnly: true
# 额外的配置
  additionalScrapeConfigs:
    name: additional-scrape-configs
    key: prometheus-additional.yaml
我mount了3个configmap分别对应3个job 树莓派温度job linux主机监控job windows主机监控job
之后就是生成additional-scrape-configs这个secret
首先编辑prometheus-additional.yaml
- job_name: 'node-exporter'
  file_sd_configs:
    - files: ['/hosts/hosts.yaml']
      refresh_interval: 5s
- job_name: 'traefik'
  static_configs:
  - targets: ['10.10.100.17:8082']
- job_name: 'rpi_temp'
  file_sd_configs:
    - files: ['/temp/temp.yaml']
      refresh_interval: 5s
- job_name: 'tplink'
  static_configs:
  - targets: ['10.10.100.17:8212']
- job_name: 'windows'
  file_sd_configs:
    - files: ['/windows/windows.yaml']
      refresh_interval: 5s
添加了需要添加的job
之后创建secret
kubectl create secret generic additional-scrape-configs --from-file=prometheus-additional.yaml --dry-run -oyaml -n monitoring > additional-scrape-configs.yaml
apply一下
kubectl apply -f additional-scrape-configs.yaml
之后创建我们的configmap
下面是我的配置
- targets: ['10.10.100.10:9100']
  labels:
    instance: 10.10.100.10
- targets: ['10.10.100.11:9100']
  labels:
    instance: 10.10.100.11
- targets: ['10.10.100.12:9100']
  labels:
    instance: 10.10.100.12
- targets: ['10.10.100.13:9100']
  labels:
    instance: 10.10.100.13
创建cm
kubectl create cm prometheus-external-node-exporter-hosts-cm --from-file=hosts.yaml --dry-run -o yaml -n monitoring > prometheus-external-node-exporter-hosts-cm.yaml
apply下
kubectl apply -f prometheus-external-node-exporter-hosts-cm.yaml
还有blackbox监控项目
我还监控了一些url
这个我就直接使用probe资源就好了
apiVersion: monitoring.coreos.com/v1
kind: Probe
metadata:
  name: blackbox-exporter
  namespace: monitoring
spec:
  jobName: http-get
  interval: 60s
  module: http_2xx
  prober:
    url: blackbox-exporter.monitoring.svc:19115
    scheme: http
    path: /probe
  targets:
    staticConfig:
      static:
      - https://www.baidu.com
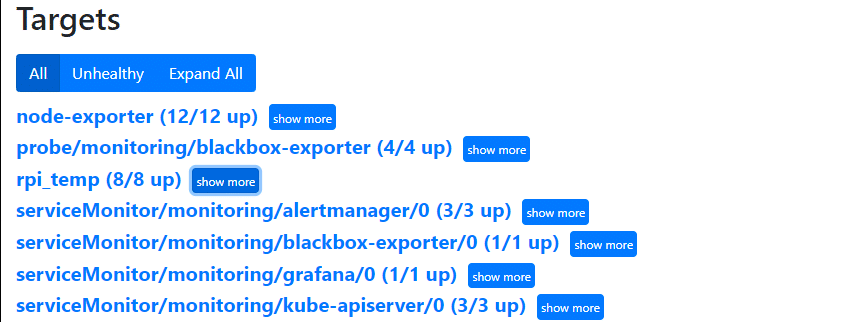
之后看下prometheus里面是不是添加了这些监控项目就好了
欢迎关注我的博客www.bboy.app
Have Fun